 (Click to enlarge)
 These curves are great for a couple of reasons. We can look at the line itself to see if the tube under test is nonlinear in any way. Non linearity would show up as squiggles in the line (this one is excellent). Also, we can use the information printed in the upper left portion of the chart to create some very well matched pairs and quads of tubes. It is interesting to see how individual tubes show their differences here, when otherwise they test as matched.
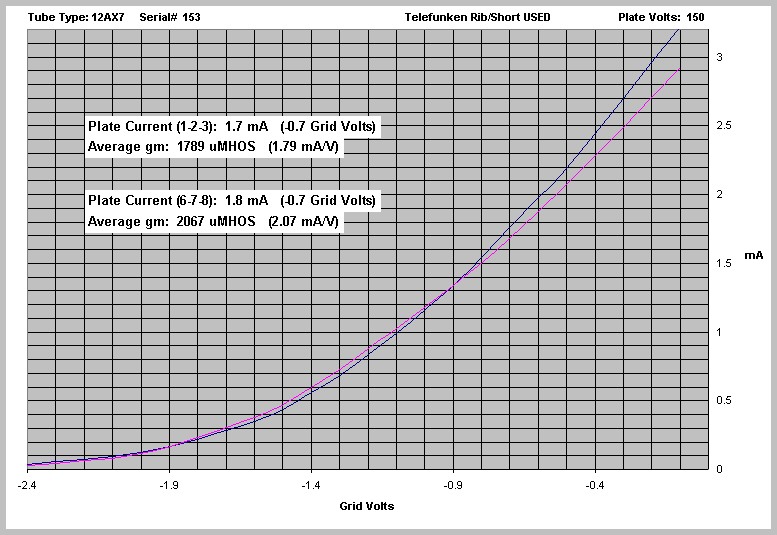
The charts are easy to interpret. Look at this example:
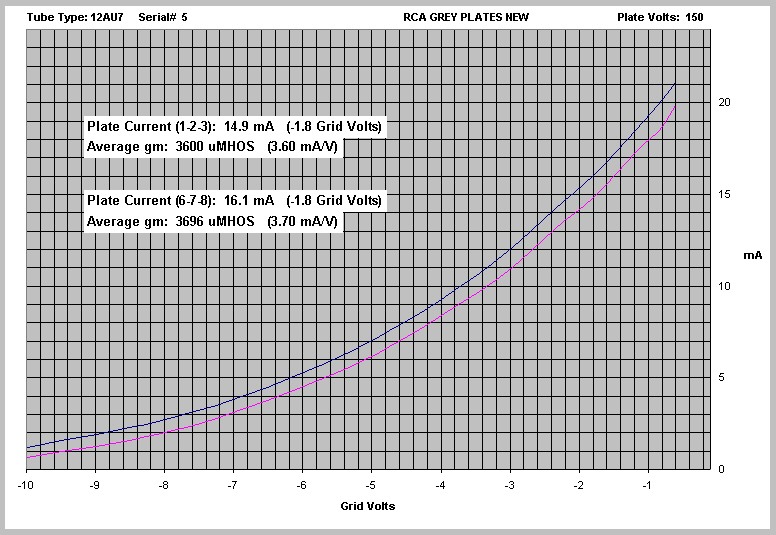
What these lines are showing you is (a) the transconductance (the slope of the line), and (b) the plate current (how high up on the chart the line is). This one is a good example of two tubes that are matched for plate current but not transconductance. The lines show two halves of a 12AX7 that measure 1.7 and 1.8 mA at -0.7 grid volts. But the transconductance of one half is 1789 uMhos, the other 2067 uMhos (the slope of one line is steeper than the other). If we were matching by plate current only then we have a good match. If we were matching by transconductance only, we would see a small (less than 300 uMho) difference, and would have no way of knowing if the plate current was matched or not. These charts show the differences very graphically. Look at the two halves of this 12AU7:
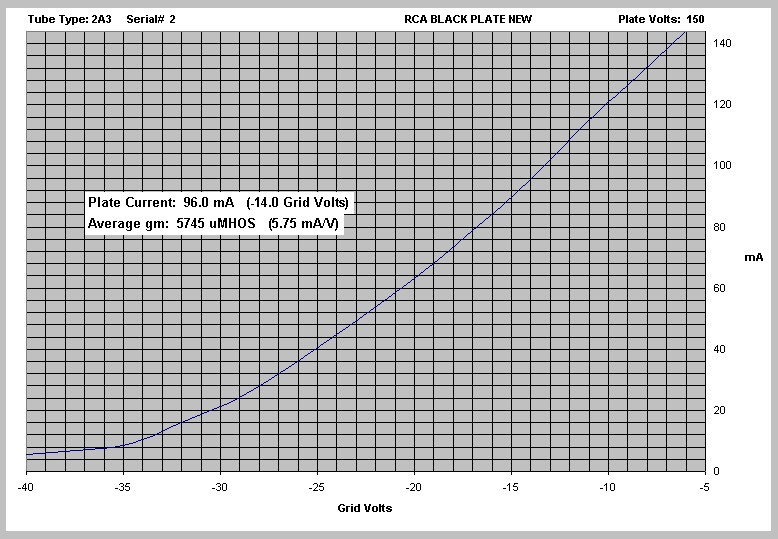
The tube halves are matched for transconductance (the lines are parallel), but not for plate current (the lines are far apart on the chart). Most traditional transconductance tube testers would show the two halves of this tube as a close match! Check out this one:
This is the curve from a NOS RCA 2A3. Do you see the defect? The tube will not reach complete cutoff. At -40 grid volts, where most 2A3s show less than 1 mA of plate current, this one is still conducting over 5 mA. This type of defect can not be detected by most tube testers.
Finally, here is a set of curves which shows properly matched halves of a 6922:
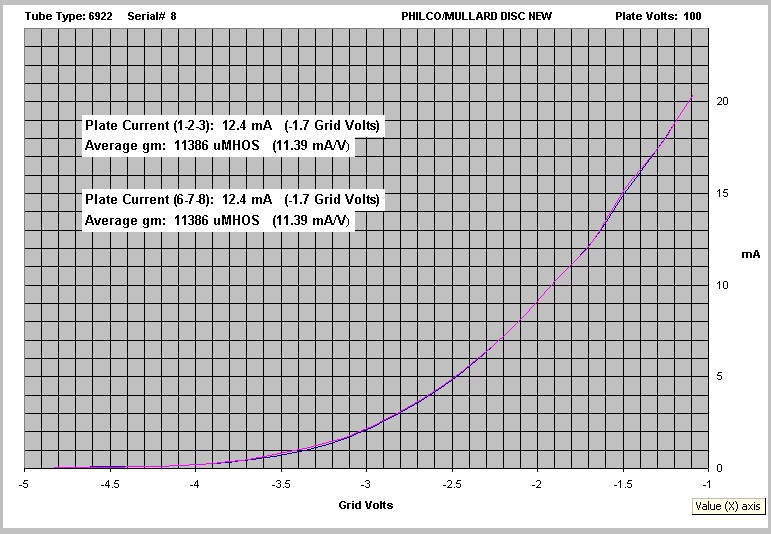 (Click to
enlarge)
(Click to
enlarge)
Now that's matched!